We've all seen those squiggly lines on medical shows or in doctor's offices – the electrocardiogram (ECG) monitor. But what do those waves and spikes mean? In this article, we'll break down the mysteries behind the ECG monitor, explaining each wave and spike and what they reveal about your heart's health.
Understanding the ECG Monitor
The ECG monitor is a device that records the electrical activity of the heart over a period of time. It does this by placing electrodes on the skin, which detect the electrical impulses generated by the heart. The resulting graph, known as an electrocardiogram, displays the heart's rhythm and can reveal important information about its function.
Understanding the ECG Waves and Spikes:
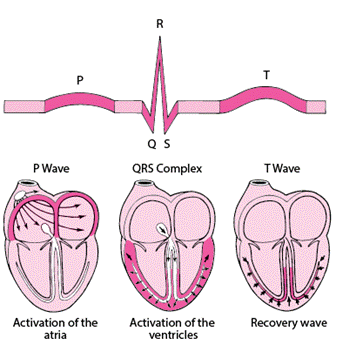
- P-Wave (The Little Bump):
- Representation: The P-wave is the first tiny bump on the ECG. It signifies the electrical impulse starting in the upper chambers of the heart (atria).
- What it Says: A healthy P-wave indicates that the electrical signals are firing correctly, initiating the contraction of the atria.
- QRS Complex (The Big Spike):
- Representation: The QRS complex is a larger spike following the P-wave, representing the electrical impulses moving through the lower chambers of the heart (ventricles).
- What it Says: A strong, distinct QRS complex indicates proper functioning of the ventricles, responsible for pumping blood throughout the body.
- T-Wave (The Small Bump After the Big Spike):
- Representation: The T-wave follows the QRS complex and represents the recovery phase of the heart's electrical cycle.
- What it Says: A healthy T-wave signifies that the heart is ready for the next electrical cycle, preparing for the next heartbeat.

Illustration from https://www.msdmanuals.com/
Decoding Heart Rate: What
Your Pulse is Telling You
Let's take a closer look at what different heart rates mean
- Normal Sinus Rhythm (NSR):
- Description: In NSR, the heart beats at a regular pace, following a consistent pattern on the ECG.
- Heart Rate: Typically, the heart rate falls within the range of 60 to 100 beats per minute (BPM) at rest.
- Visual on ECG: The waves and spikes follow a steady and predictable pattern.
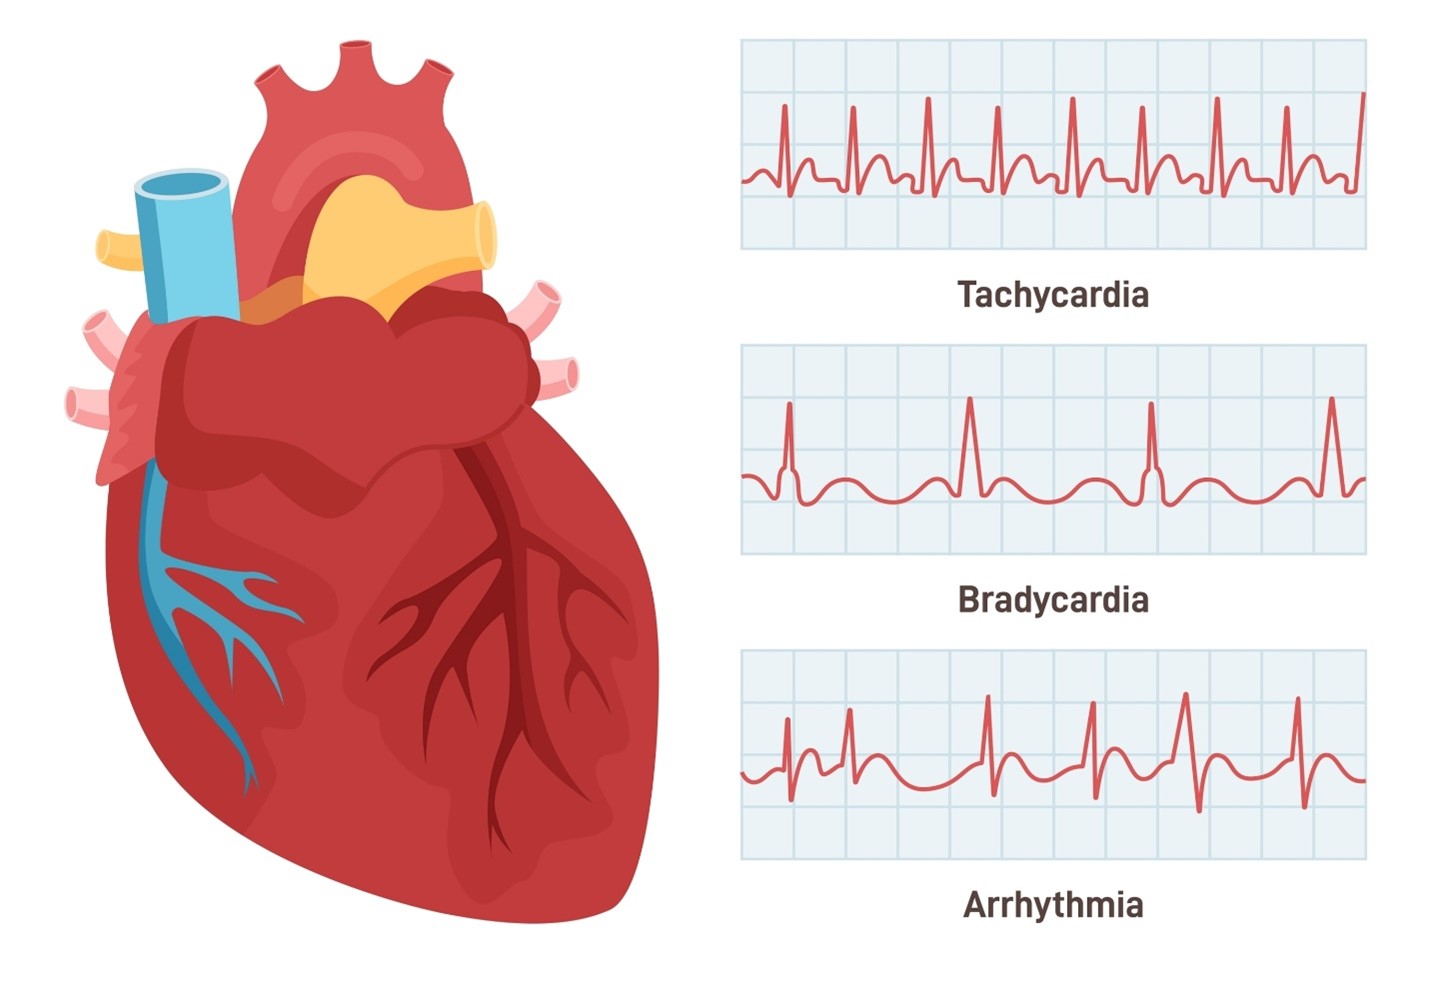
- Tachycardia:
- Description: Tachycardia occurs when the heart beats too fast.
- Heart Rate: Heart rates in tachycardia can exceed 100 BPM at rest.
- Visual on ECG: The waves and spikes on the ECG appear closer together, indicating a rapid heartbeat.
- Bradycardia:
- Description: Bradycardia happens when the heart beats too slowly.
- Heart Rate: Heart rates in bradycardia may fall below 60 BPM at rest.
- Visual on ECG: The waves and spikes on the ECG appear spread out, indicating a slower heartbeat.
- Arrhythmia:
- Description: Arrhythmia refers to an irregular heartbeat pattern.
- Heart Rate: The heart rate in arrhythmia can vary and may be irregular.
- Visual on ECG: The ECG may show erratic patterns, with irregular spaces between waves and spikes.


